luminescence.de: A science blog
by Dirk Mittelstraß | Last update: Mar 13, 2026
Luminescence dating might be the best tool to determine the age of landscapes and archaeological artefacts in the last 400,000 years. This blog is about publications which I find interesting or where I contributed too. And it is about my own two projects: The R package OSLdecomposition for enhancing the accuracy of optically stimulated luminescence (OSL) dating, and the further development of the radiofluorescence dating method for obtaining sediment chronologies and provenance marker.
2026-03-13 R package OSLdecomposition 1.2 published
Version 1.2 of my R package
OSLdecomposition has just been published on CRAN!
While this update does not introduce any new features, it is all about
polishing and bug-fixing, see the changelog
for more information. Most notably, it ensures compatibility with the
in-parallel releasead R package Luminescence 1.2.0, which
was published in parallel and contains some script
breaking changes.
2026-01-08 Quaternary publication map
At the beginning of last year, I spent my evenings working on a small side project. I created an interactive map of luminescence dating sample sites from various publications:
Now, finally, I have uploaded a tutorial showing you in detail how to create such a map in R.
R tutorial: Quaternary publication map
The database as well as the R code, are freely available at GitHub:
github.com/DirkMittelstrass/QuaMap
Please feel free to use the code for your own projects!
Dislcaimer: The above displayed map is based on the Leaflet package and the OpenStreetMap project. All overlay information originates from copyrighted publications. To the best of my knowledge, the interactive map qualifies as fair use for non-commercial purposes. If any copyright holder believes their rights are infringed, please contact me and the relevant data will be removed.
2026-01-02 Project ARENICOLA
![]()
I am very happy to announce that I have been a full-time researcher and PhD student for a few months now!
Since August 2025, I’m developing a new luminescence imaging technique as part of the DFG project ARENICOLA. Our goal is to develop an efficient workflow for measuring and analysing sand grains to identify their mineralogy and defect inventory using radiofluorescence imaging at multiple spectral bands between 360 nm and 920 nm. If the project is successful, this new technology could simplify the preparation of luminescence dating samples or be used to analyse the provenance of river sediments. See our poster at the DLED 2025 in Heidelberg to find out more.
I will post progress and insights on this page. Alternatively, follow me on LinkedIn to stay updated.
2025-09-01 R package OSLdecomposition 1.1.0 published
My R package about signal deconvolution got an update! In addition to some bug fixes, the update focuses on two topics: a) prettier, more customisable and bug-free component plots, and b) test scripts with automatically generated reports (see this example) for some first functions. This way, I like to ensure code quality of my package.
If you use the package, please don’t forget to cite it using this DOI: doi.org/10.32614/CRAN.package.OSLdecomposition
2024-11-12 Back from the DLED 2024
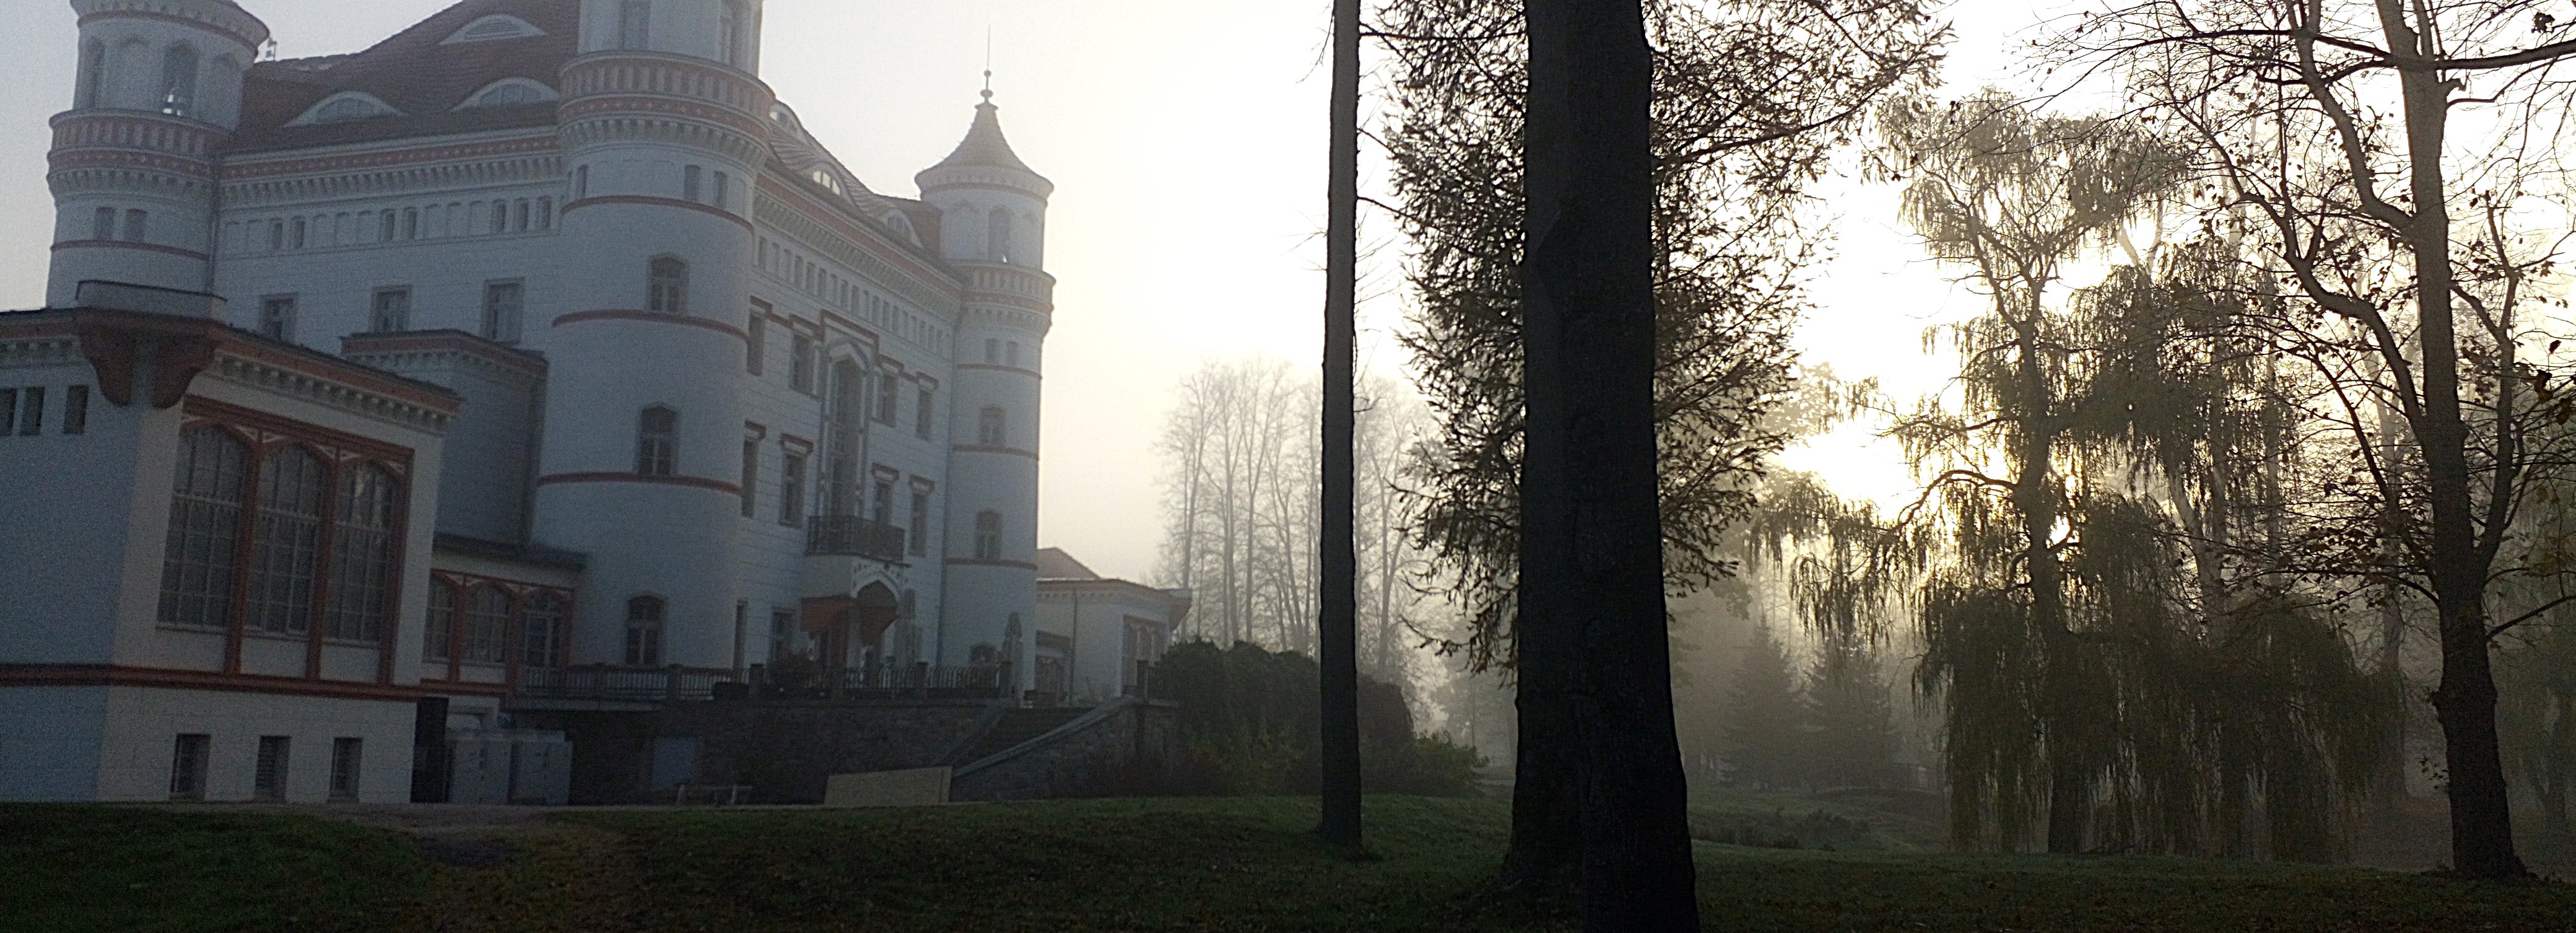
The Central European luminescence and ESR dating conference this year was held in Jelenia Góra, Poland. It took place at a beautiful castle (see picture). Organisation and catering were great! Many thanks to the organisation team consisting of Fatima, Grzegorz, Konrad and Joanna from the Silesian University of Technology and miDose.
Of course, there were also some interesting talks and posters. For the luminescence dating community the following news are probably the most interesting:
The jounal Geochronometria has a new website and two new editors. And best of all, it is free-of-charge until further notice.
The journal AncientTL also has a new website and a new chief editor, Christoph Schmidt from the University of Lausanne. As ever, AncientTL is also free of charge. However, it is not indexed. On the other hand, publishing in AncientTL is quite fast and less restrictive. This means that it is particularly suitable for side projects that do not fit into any other luminescence dating journal.
Freiberg Instruments now offers a single-grain OSL laser stimulation module for their Lexsyg Research devices. I’m curious how the first experience reports from users will be.
And of course, I participated with a poster. This time, I had a look if IR-RF signal curve features can be used to distinct between samples of different origin using Principal Component Analysis. And yes, it works:
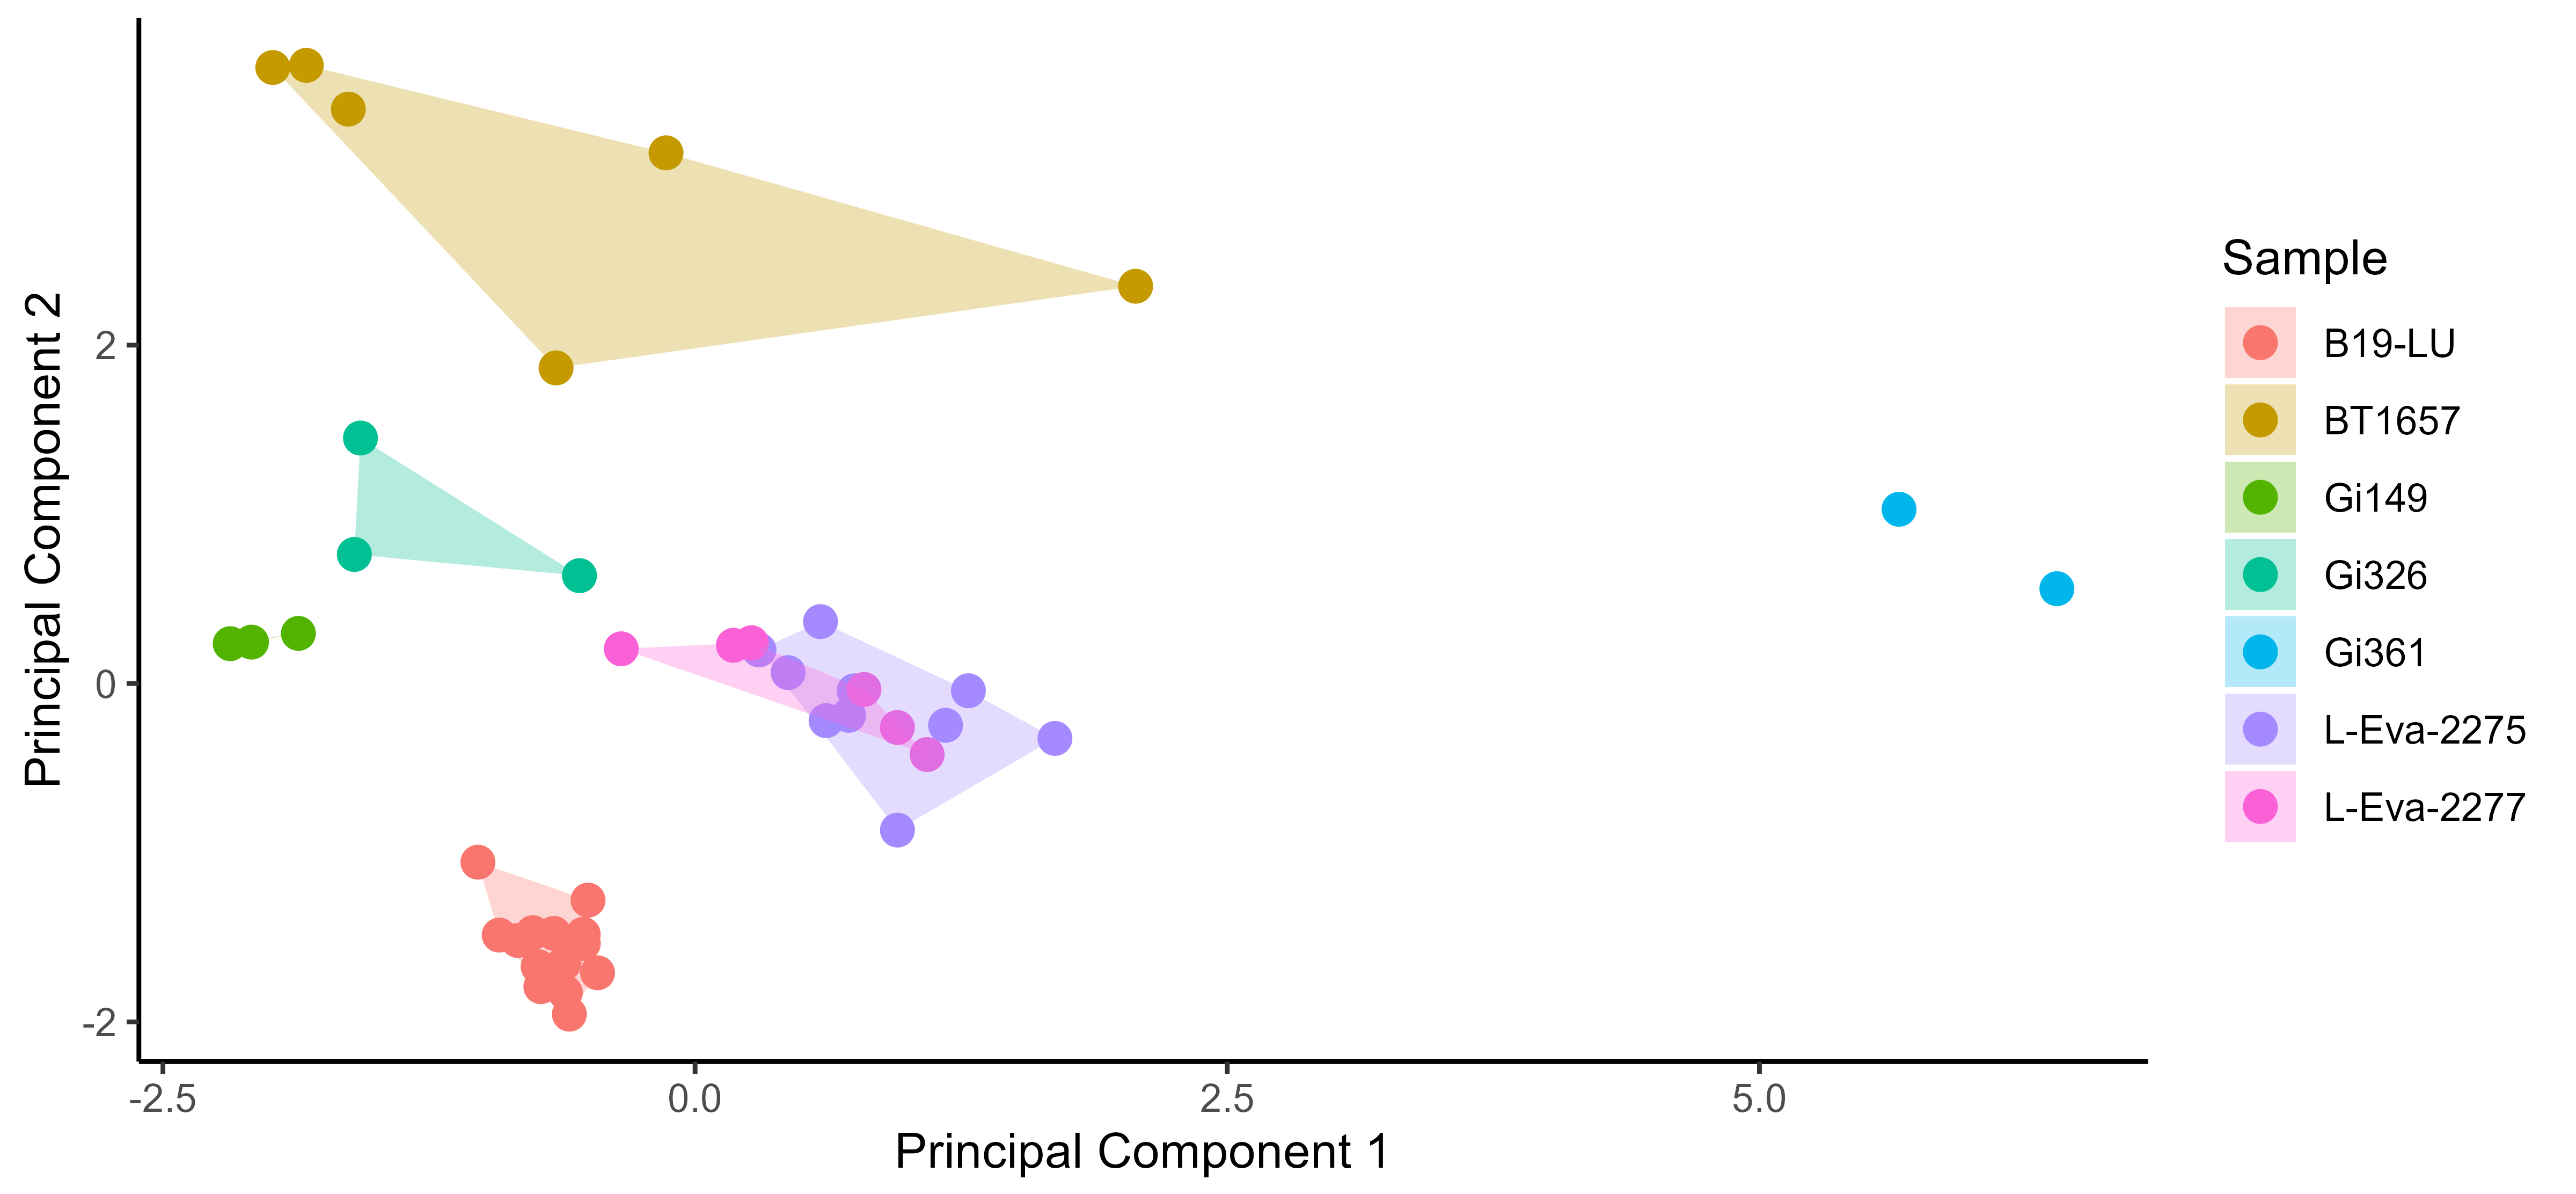
For more information, see my poster here.
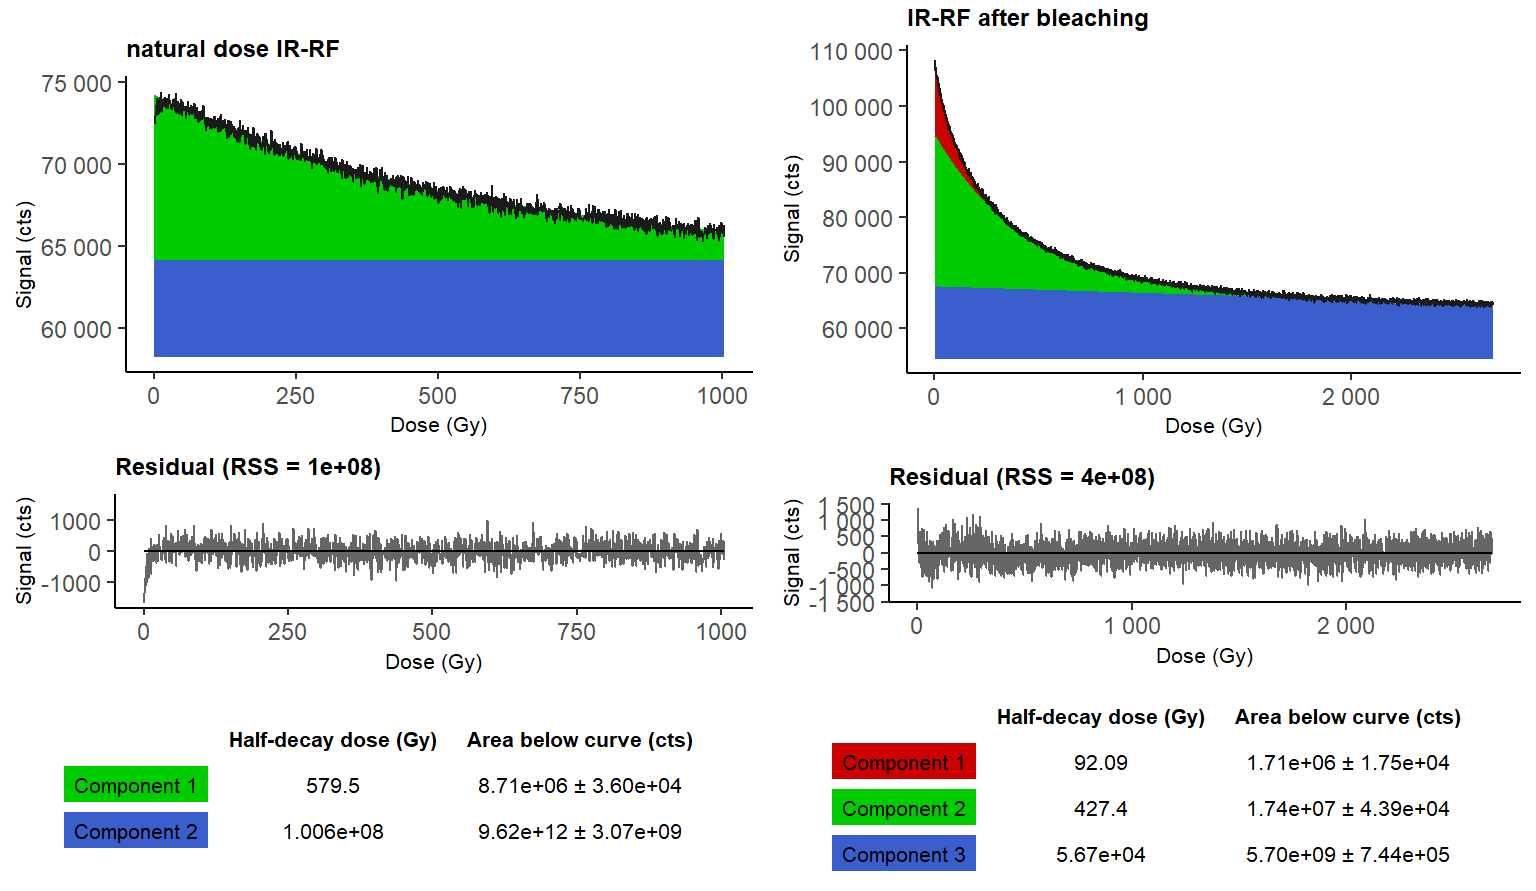
2023-06-25 IR-RF component fitting
In my latest side project, I analysed the shapes of IR-RF signal curves of a variety of K-feldspar samples with methods from OSLdecomposition. Apparently, IR-RF curves can be sufficiently described by multi-exponential fittings, see the example below. Although further investigations are necessary, I summarized my findings in my poster for the LED conference 2023.
2022-11-16 Sontag-Gonzales et al. (2022) published in Radiation Measurements
A new scientific paper I co-authored is published: Wavelength calibration and spectral sensitivity correction of luminescence measurements for dosimetry applications: Method comparison tested on the IR-RF of K-feldspar written by Mariana Sontag-Gonzales who is part of Markus Fuchs’s work group in Giessen. Mariana did an excellent job in describing multiple approaches for wavelength and sensitivity calibration of for luminescence spectroscopy and comparing them. As case study, the paper includes also IR-RF peak analyses of two K-feldspar samples. doi: 10.1016/j.radmeas.2022.106876.
2022-08-14 Package OSLdecomposition is released on CRAN
Finally, my OSLdecomposition function library for R is released on CRAN. The package can now be installed using the RStudio package manager or by simply typing this into your R environment:
If you are not familiar with what it is all about or how to use the package, check out the Introduction & Tutorial page.
2021-06-19 Spatially resolved IR-RF paper published / vDEUQUA 2021
The research article presenting the method of grain-wise IR-RF dating of K-feldspars developed by Sebastian Kreutzer and myself has passed the review process in Geochronology and is now officially available at doi.org/10.5194/gchron-3-299-2021.
If you would like to discuss the future of IR-RF dating with me or Sebastian, why not register for the vDEUQUA 2021 online conference? The vDEUQUA is about quaternary climate and environmental changes, the methods to investigate them and how quarternary processes shaped our todays world. The conference is virtual, free of charge and happens from 2021-09-30 to 2021-10-01. See you there!
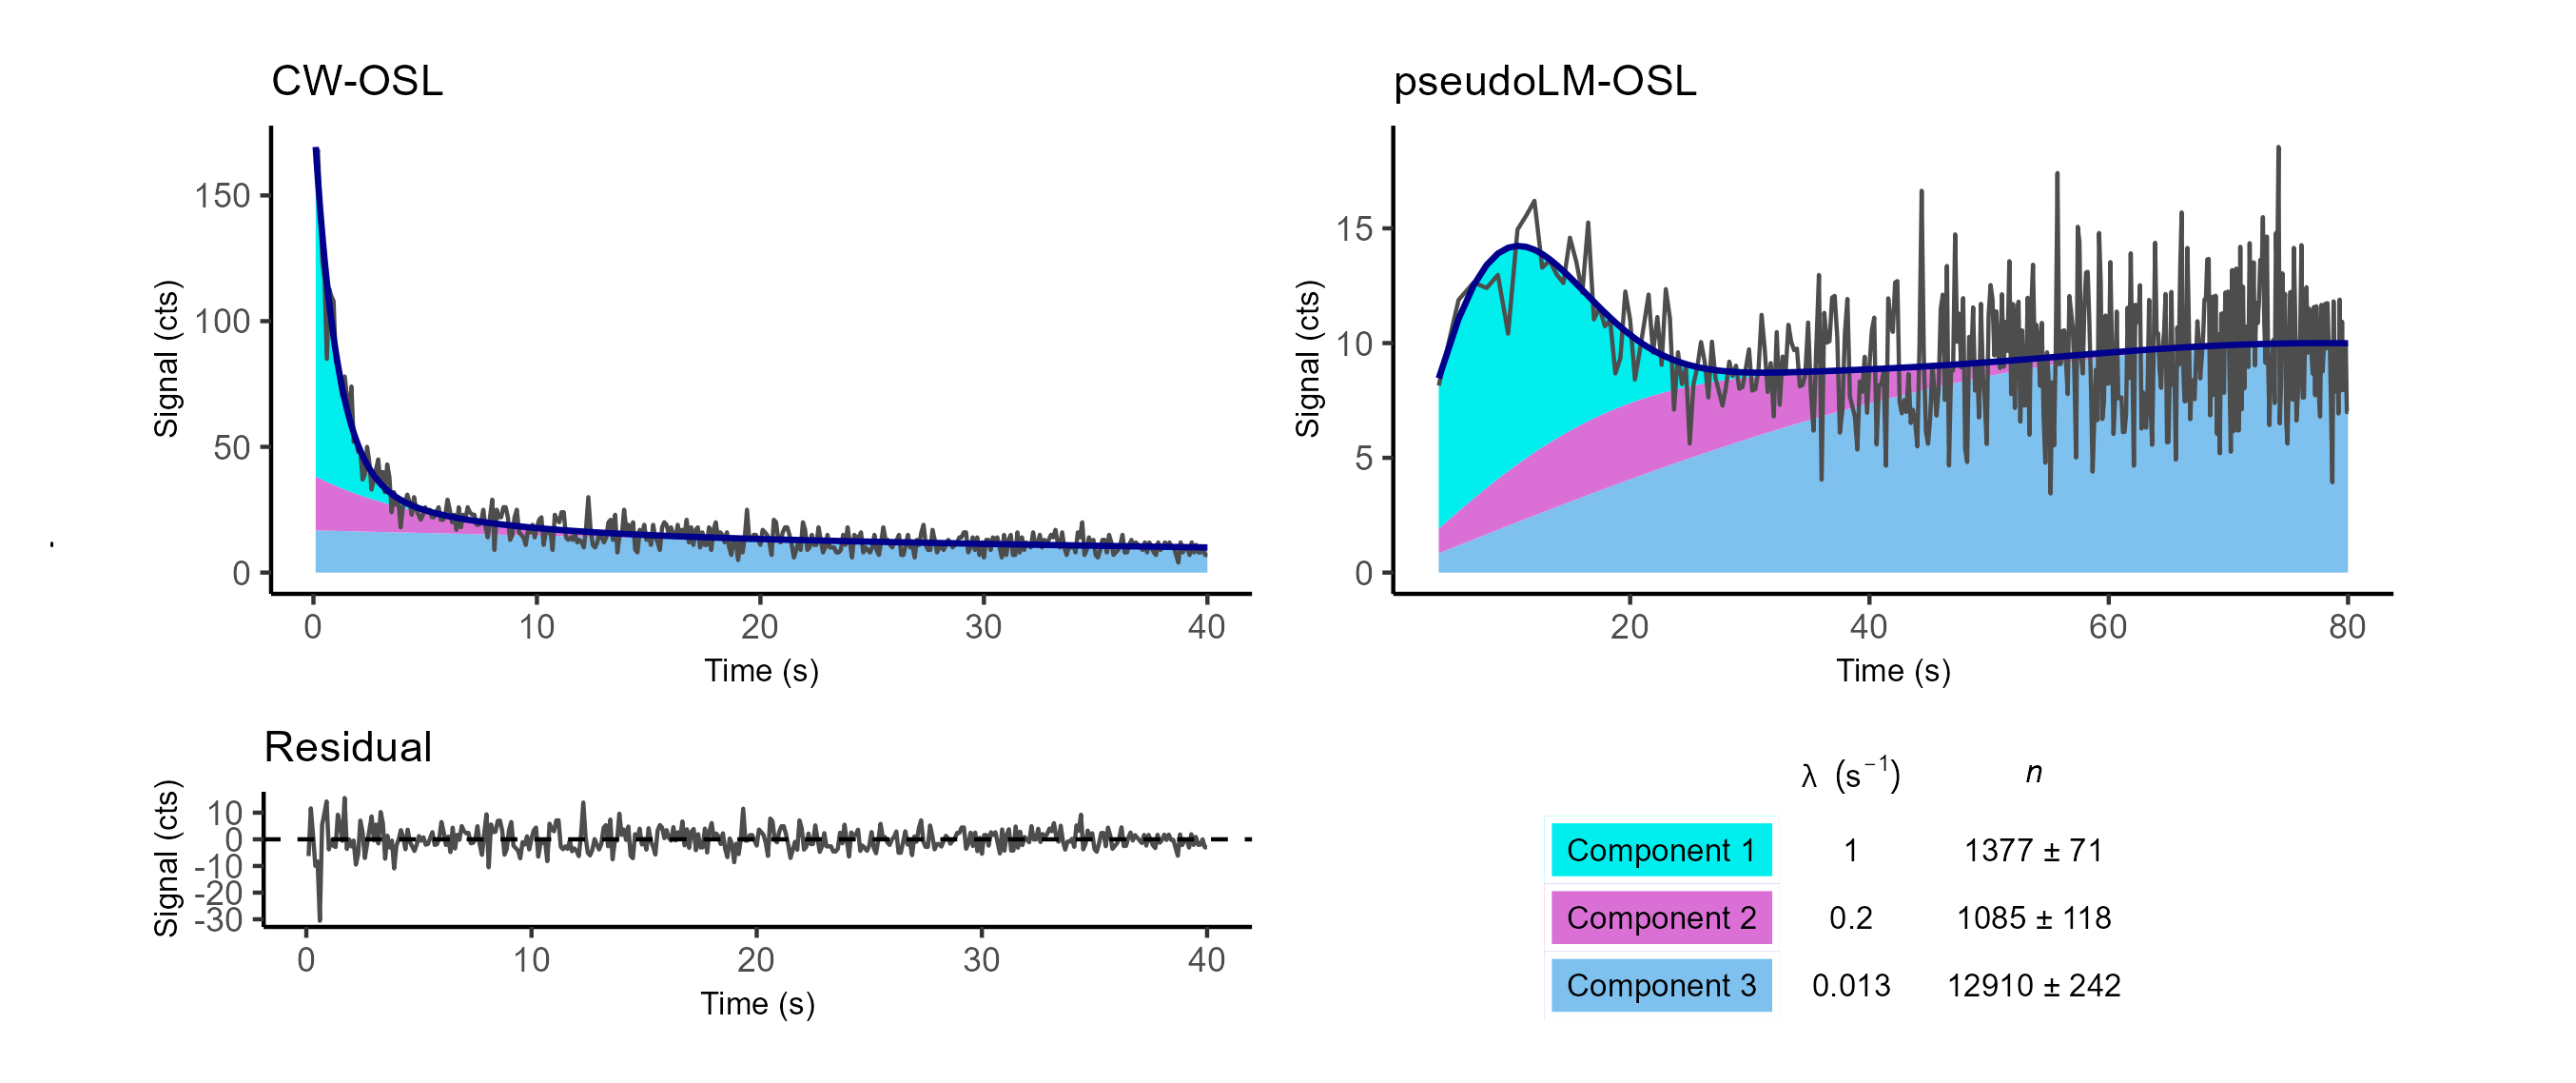
2020-11-26 ‘OSLdecomposition’ pre-release
Just in time for the DLED2020,
we released our R package OSLdecomposition for
signal component identification and separation in multi-exponentially
decaying measurements. Our focus laid on continous-wave optically
stimulated luminescence (CW-OSL) measurements of quartz samples for
dosimetry purposes. But you might find the package helpful for other
applications too. Check out our DLED
poster for a quick introduction into the Why and
How.
© Dirk Mittelstraß, 2020 - 2026 | This website was created with Rmarkdown