SR IR-RF installation guide
In the following, you will find the download links and details on the software installation to analyse spatially resolved infrared-radiofluoresence (SR IR-RF) measurements. You will also find a simple tutorial guiding you through your first SR IR-RF analysis. See our publication Mittelstraß and Kreutzer (2021) or the SR-RF macro Handbook for more information.
To exploit the outlined SR IR-RF image analysis workflow, two different software environments are used: ImageJ for image processing and R with the package Luminescence for data analysis. Both environments need to be installed and set-up separately.
Image processing with ImageJ
The spatially resolved radiofluoresence (SR-RF) macro is an ImageJ macro to transform raw RF image data into single-grain RF curves. The macro can either be embedded into (1) a basic ImageJ installation or (2) a more function-rich ImageJ distribution like ImageJ2, Bio7 or Fiji. We recommend option (1) for application-only users and option (2) with Fiji for scientists interested in developing own image processing solutions.
Download and installation
To install just the core version of ImageJ plus the SR-RF macro, perform the following steps:
| Step | ToDo | Link |
|---|---|---|
| 1 | Download and unpack the latest version of ImageJ | imagej.nih.gov |
| 2 | Download the SR-RF macro package
(macro, handbook and necessary plug-ins) and unpack it
into the folder of ImageJ (Handbook and
imagej.exe must be in the same folder) |
SR_RF_macro.zip |
| (v0.1.0; 2 Mb) | ||
| 3 | Start ImageJ and check if enough memory is allocated by clicking Edit -> Options -> Memory & Threads. At least 2500 MB should be allocated. Recommended are 75 % of your systems RAM | |
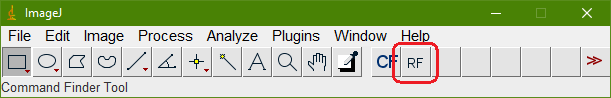
To execute the macro, load the raw image data into ImageJ (Drag & Drop will work) and click the “RF” icon at the toolbar:
Update existing ImageJ version
You can embed the SR-RF macro to existing ImageJ installations or any software distribution based on ImageJ. Perfom the following steps:
| Step | ToDo | Link |
|---|---|---|
| 1 | Download the SR-RF package and unpack it | SR_RF_macro.zip |
| (v0.1.0; 2 Mb) | ||
| 2 | Copy the file SR-RF.ijm from into the
subfolder /macros of your ImageJ distribution |
|
| 3 | Check if your ImageJ distribution has the plug-in
TurboReg already installed. If not, download it from
its origin or take it from the SR-RF package and copy all files into the
subfolder /plugins |
TurboReg webpage |
| optional | To add a RF symbol to your toolbar,
insert the following line in a file called StartupMacros.*
located in /macros: |
Getting started
We recommend to run the SR-RF macro and the subsequent data analysis at least once before getting into the details.
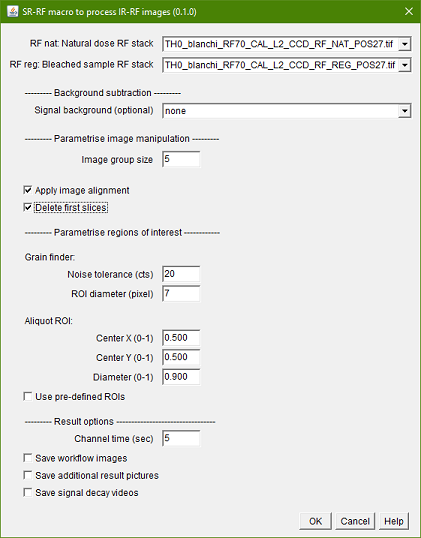
If you don’t have you own RF image data available, you can download
the data we used at ![]() . Open the two
. Open the two .tif files in the subfolder
\Results\TH0_P27_SRIR-RF and start the SR-RF macro. Set the
macro parameters like below:
The macro will show you several images. The most important one is this:
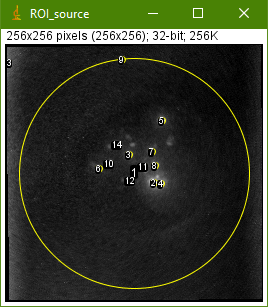
The numbered yellow circles are the regions-of-interest (ROI). In the best case, each grain will be covered by one ROI. The grain detection sensitivity can be improved by selecting a lower Noise Tolerance parameter in the next run. This, however, will also increase the likelihood of ROIs covering image artifacts. You will find more information about the macro and its parameter in the SR-RF handbook.
In the case of our example data set, ROI 9 and ROI 13 are image artifacts. ROI 1 includes the signal of the whole sample cup. In conclusion, 11 out of the 14 ROIs represent actual sample grains.
The image processing results are saved in a subfolder named after the
natural dose RF data file (here:
\TH0_blanchi_RF70_CAL_L2_CCD_RF_NAT_POS27.tif_2021...). The
single-grain IR-RF curves are saved in the file
table.rf.
Data analysis with R
The result file table.rf can be analysed in the
statistical computing language R, which you can
download here.
We also recommend to install the standard IDE for R, RStudio.
However, the following code snippets will also work without RStudio.
We deploy the package Luminescence, which can be installed with a single line of code:
Be aware, that version 0.9.9 or newer is needed. You can
update your installation of Luminescence with the code
line above, if you are still working with an older version.
The following script is a simple data analysis example:
# load R package 'Luminescence'
library(Luminescence)

# import data file table.rf
file <- file.choose()
RF_data <- read_RF2R(file)

# determine equivalent doses
equivalent_doses <- analyse_IRSAR.RF(
  object = RF_data,
  method = "SLIDE",
  method.control = list(
    vslide_range = "auto",
    correct_onset = FALSE))

# plot dose distribution
plot_AbanicoPlot(equivalent_doses)
Detailed information about the functions can be gained by typing for
example ?analyse_IRSAR.RFin the R
console.
Automatized data processing
Calling the SR-RF macro can be automatized with the experimental R package RLumSTARR. Execute the following lines in an R session to install the package:
# Download and install the Developer Tools package if not already installed
if(!require("devtools")) install.packages("devtools")

# Download and install the master branch from RLumSTARR from GitHub
devtools::install_github("R-Lum/RLumSTARR")
Check out the in-package documentation or the R scripts in the example data to learn how to use RLumSTARR. Be aware, that the package is in an early stage of development. You may encounter bugs. Please report them on as “Issue” at the GitHub page of RLumSTARR.
Participation and bug reporting
The future of the method depends on the participation of the community. If you want to contribute, report bugs or if you have any useful comment, please write an Issue at the GitHub page of the software:
| Software | GitHub link |
|---|---|
| SR-RF macro | https://github.com/DirkMittelstrass/SR-RF |
| R package Luminescence | https://github.com/R-Lum/Luminescence |
| R package RLumSTARR | https://github.com/R-Lum/RLumSTARR |
Citation
If you publish spatially resolved IR-RF results obtained with our software, please include the following citation to your publication:
Mittelstraß, D. and Kreutzer, S.: Spatially Resolved Infrared Radiofluorescence: Single-grain K-feldspar Dating using CCD Imaging, Geochronology, 2021 https://doi.org/10.5194/gchron-3-299-2021
© Dirk Mittelstraß, 2020 - 2026 | This website was created with Rmarkdown